Visualising the Society and the Personal

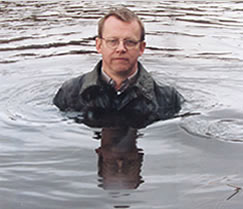
I just finished watching Hans Rosling’s documentary for the BBC “The Joy of Stats”.

Hans Rosling is the ebullient swedish professor who came to widespread public recognition through his passionate TED talks where he used statistics to unravel and debunk many widespread myths and misunderstandings about world health and the third world.

The documentary “The Joy of Stats” is a one hour whistle-stop tour of the history and power of statistics to predict and understand our world.

And it got me thinking.

Rosling, like many others, predicts that visualisation has the power to transform the way we think of data and allow us to understand and interpret vast amounts of information.

“Visualisations tell us stories”, he says

Or do they?

Hans Rosling is a remarkable story teller. The TED talks which brought him to mainstream attention are a fabulous example of a man telling a story with three acts, emotional arcs and a wisdom all illustrated with pictures and animations. He finishes, leaving you entertained, excited and above all informed.

Here’s the crux. It wasn’t the picture, the visualisation, telling a story. It was Hans Rosling! I’m sure that if I had seen the data and the visualisations without his explanation, I would have only had the smallest amount of insight. You need lots of other contextual information to make sense of it all.

Now, I don’t want to say that this all a big waste of time. It definitely isn’t.

But as an individual person looking at some information that’s been visualised, what am I supposed to do with it?

I think real insight often comes with a razor sharp focus. In this case, Hans Rosling is the person with that focus.

This brings me to the second part of what struck me after watching the programme. It’s to do with the visualising data about a large group of people versus visualising data for one person.

Statistics developed out of a need to understand what society as a whole was doing. How many people are dying? What’s the average life expectancy? Is our population growing or shrinking?

The answers to those questions are used by politicians and policymakers to affect change on the societal level.

We’re using the outcome of statistics to pull levers to affect change to all of society to get an outcome that we want.

Something of the language that Hans Rosling used puzzled me. I think it’s been bothering me a while because lots of people do this.

It’s implied that visualising data is a way for ordinary people to understand and interpret data themselves, effectively giving them access to the same analytical machinery that once was only available to the few, in the process democratising the machinery of decision making.

I think this is an important and truly revolutionary goal but the way that we’re going about it is missing the mark.

Why?

Because we’re still tending to think about visualisations from the point of view of someone very far off the ground, seeing the actions of the people as little ants scurrying around.

To make visualisation a democratic tool we need to make visualisations that allow us to make decisions about our own lives.

And I don’t mean, “by looking at this data I can see that there is a strong correlation between smoking and lung cancer. I don’t want to get lung cancer. Therefore, I shouldn’t smoke.”

Boring!

Correlations and statistics by their very nature can not say “if you smoke, you will die twenty years earlier”. It’s only a statistical link. So their ability to persuade anybody to do something is very limited.

So then how do we make a visualisation personal?

Focus on the concrete.

Let me give you a simple example. It’s not strictly a visualisation, but it illustrates the point quite well.

Let’s say that every house on your street is roughly the same size with about the same number of people living in them and imagine that each house has an electricity meter in it which records power usage and stores that information. Let’s say that there is data for the last year.

What could you do with that?

You could draw some graphs that would show the average energy use of a house on the street and show how it changes over the year. You might discover that there is a large spike during the summer. You look deeper and find out that’s because everyone is running their air-conditioner. That’s an example of using that data in a very top-down way, looking at the little people from above.

What if instead you could see whether your energy use over the last hour was lower or higher than the average of your neighbours’ ?

You could actually use that information in a very tangible practical way. You might discover that when your refrigator makes a noise and kicks in there’s a spike in your energy use and suddenly you’re using more energy than your neighbours.

Or let’s say you don’t make it about competition with your neighbours but rather with yourself. What if you just see if your energy use is lower or higher than your own energy use exactly a year ago? If you wanted to reduce your energy use you would have a really tangible and simple tool to help you do that.

I think this whole discussion also has an influence on the kinds of information we should be working towards getting governments to release.

Currently, the focus appears to be on the kind of information that comes from the top down approach. For instance, here in Australia, the gold standard for open government data right now is the Australian Bureau of Statistics that have for some time now released large amounts of census data in good machine readable formats available under licenses that allow liberal reuse. It’s amazing what you can find there.

But, it’s very hard to see how to create a personal visualisation out of any of it.

So, we have a challenge.

What data should we get from government which we can use to create visualisations that can allow a person to make decisions about their life?

Posted in Uncategorized | Tagged , , , , , , , , , , | Leave a comment

Little OpenAustralia Hackfest, Big Results

Cross-posted on the Official Google Australia Blog.

A couple of weeks ago we at the OpenAustralia Foundation – Australia’s open data, open government and civic hacking charity – asked if anyone wanted to join three of our volunteers at Google Sydney for a hackfest. The request was deliberately casual as we just wanted have a bit of fun over a weekend sharing what we where doing and working on the open source projects that OpenAustralia runs.

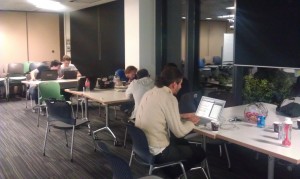
The hackfest started on Saturday with about a dozen volunteers coming along and listening to quick introductory talks from Matthew and myself. We reminded everyone of the different projects that the foundation runs: OpenAustralia.org, Election Leaflets and PlanningAlerts.

Most people decided to hack on PlanningAlerts, a project which allows people to get alerts about what is being built or knocked down in their area. Using an online tool called ScraperWiki you can quickly and easily contribute new planning authorities to PlanningAlerts. During the two afternoons (true hackers aren’t morning people!) our volunteers took up the challenge to write ScraperWiki scrapers for PlanningAlerts with zeal.

Seven people wrote scrapers for nineteen planning authorities like Hobart City Council, Redfern-Waterloo Authority or Townsville City Council all around Australia, including councils in two states we previously didn’t cover – Western Australia and Tasmania.

What does this mean in practical terms? An additional 1,823,124 Australians can now find out what’s happening in their local community using PlanningAlerts. This is a huge result, coming from a relatively modest effort and a small group of people.

A massive thank you to all of the volunteers that attended the hackfest, especially the following people that wrote scrapers: Sam Cavenagh, Nick Evershed, Mark Kinkade, Matthew Landauer, James Polley, Kris Splittgerber and Adam Stiskala. Let’s do this again some time.

And don’t forget to remind your friends and family to sign up for PlanningAlerts!

Posted in Announcement, Development, OpenAustralia Foundation, PlanningAlerts.org.au, Projects | Tagged , , , , , , | Leave a comment

PlanningAlerts for my mum (and the Northern Territory)

My mum called me from Sydney Airport yesterday. She was stopping over from New Zealand on her way to Batchelor in the Northern Territory where her and her husband are moving.

After I got off the phone to her I remembered that PlanningAlerts didn’t cover anywhere in the NT and I also remembered – what mother doesn’t love code written for her!

So I got to work and found that there seems to be a single planning authority in the NT, the Northern Territory Lands Group. After an hour or so I’d been able to write a ScraperWiki scraper for this data and deploy it to the live site, which means PlanningAlerts now covers another 229,675 people in the Territory.

Welcome to Australia mum and welcome to PlanningAlerts Territorians!


View Larger Map

If you live in the territory and you’ve signed up for PlanningAlerts you should already be getting alerts. If you have friends or family in the territory, please let them know about PlanningAlerts.

Cheers,

Henare
OpenAustralia Foundation volunteer

P.S. If anyone has any more information about the NT planning system that I may have missed or information about any other planning systems around Australia that might be of interest, please let us know in the comments.

P.P.S. If your mum lives in an area not covered by PlanningAlerts, why not write a scraper for her today? No need to wait for Mother’s Day, mums like code all year ’round :)

P.P.P.S. Come to our hackfest tomorrow if you want to learn how to write your mum a PlanningAlerts scraper.

Posted in Announcement, PlanningAlerts.org.au | Tagged , , , , , , , , | 2 Responses

OpenAustralia Hackfest – “What are you up to next weekend?” edition

Come and join Henare, Tim and Matthew in their basement, er.. we mean Google Sydney, for an awesome weekend of hacking.

OpenAustralia Hackfest 2009 by Halans

It’s all a bit last minute. What’s the worst that happens? Nobody turns up and the three of us spend the weekend hacking. That’s okay too.

However, it would be much more fun if you came too!

We’ve got a couple of quick talks lined up to warm you up and give you some inspiration, then a full weekend dedicated to hacking on everything OpenAustralia. Come along and learn, share and build interesting things in and around open data, open government and civic hacking.

Want to reboot OpenAustralia.org by fixing the scraper? How about some finishing touches to Election Leaflets to monitor future Australian elections? Or do you want to learn how to help tens of thousands of people get PlanningAlerts by writing a simple scraper (anyone can do it!)? Then register here:

https://oa-hackfest.eventbrite.com/

This event will be hosted at Google Sydney next weekend the 10th and 11th of September, here’s our plan for the weekend:

Saturday

11:30 – Doors open
12:00 – Introduction and housekeeping
12:15 – The Gears That Power the Tubes of OpenAustralia – Matthew Landauer
12:30 – An Introduction to Guerrilla Data Liberation with ScraperWiki – Henare Degan
12:45 – Let the hacking begin
18:00 – We’ll order pizzas with anyone interested
22:00 – Doors close

Sunday

11:30 – Doors open / Let the hacking begin
16:00 – Stop hacking, start presentations – show us what you’ve build, fixed or learnt!
18:00 – Doors close, optional beers at the pub

Google are kindly supplying the venue, power and WiFi so all you need to do is bring along your notebook, some snacks to keep you hacking through the day and pizza money if you’re a hungry hacker come Saturday evening.

Sign up to the OpenAustralia Community mailing list if you have any questions and don’t forget to tag your tweets, photos, etc. #oahack

Cheers,

Henare, Matthew and Tim
OpenAustralia Foundation volunteers

Posted in Announcement, Development, ElectionLeaflets.org.au, OpenAustralia Foundation, OpenAustralia.org, PlanningAlerts.org.au, Projects | Tagged , , , , , , , , , , | 1 Response

Archive of 2010 Australian Federal Election leaflets available

You may recall that when we ran Election Leaflets for the 2011 NSW State Election, we stopped displaying leaflets from the 2010 Federal Election when you browsed the site. This was simply because we didn’t have the time or resources to build the site in such a way that you could see these leaflets.

We’ve had a few requests over the last few months for access to these leaflets so we’ve set up an archive site that allows you to see them: federal2010.electionleaflets.org.au

This is by no means a permanent solution for being able to use the site for multiple elections – us geeks would call it a hack. To run Election Leaflets for another election, we still need interested volunteers or organisations willing to fund the work required to provide Australia with live election monitoring. Please contact us if you can help.

Posted in Announcement, ElectionLeaflets.org.au | Tagged , , , , , | Leave a comment

PlanningAlerts closes the loop

Our built environment has a huge impact on our lives. And we all have strong opinions about what it should be like.

One of the major things that determines this is the planning process that our councils look after. If you’ve ever tried to make a submission on a development application you will know that it can be a difficult process to understand. Chances are you’ve not bothered because it all seemed like too much trouble.

Today we want to let you know about a new PlanningAlerts feature which makes this simple. Now when you click on a development application, you’ll be able to make a submission to council right on the PlanningAlerts page for the application – no more hunting down the right form, email address or even which council to send it to. We do the boring stuff for you automatically.

Commenting on a PlanningAlert

This means you have the opportunity to directly affect whether an application will get approved or not. It “closes the loop”, so that not only do you find out about things planned near you, you can easily and directly do something about them.

You also get to see what other people have said because all comments automatically go up on the site once they’re sent to the planning authority.

Over the next couple of weeks we will be rolling out the new feature, adding it council by council. When the feature has been rolled out for your council you will see the big new comment box. If it hasn’t been rolled out yet you can help by finding the email address that submissions should go to for your council and sending that to us.

As this feature is brand new it’s bound to have some niggling problems. So, please help by letting us know about any problems that you find or things that could be done to improve the service.

To get started go to http://www.planningalerts.org.au/ and enter your street address.

It’s your neighbourhood. Make sure you have a hand in how it develops.

Matthew and Henare
OpenAustralia Foundation Volunteers

Posted in Announcement, PlanningAlerts.org.au | Tagged , , , , , | 3 Responses

People of NSW – start your scanners!

…or mobile phone cameras.

We have just over seven weeks until the NSW State Election and it’s going to be bitter. Leaflets are already in the news and people have been calling on us to run Election Leaflets during this election.

Luckily Tim ‘mithro’ Ansell and I recently attended linux.conf.au in Brisbane and as we did last year we decided to spend what little free time we had hacking on OpenAustralia Foundation projects.

This time we chose Election Leaflets and the good news is we’ve done it. I’m very pleased to announce that we’re running Election Leaflets for the 2011 NSW State Election.

From today, when you visit ElectionLeaflets.org.au you’ll see election leaflets that have been uploaded by people all over the state that want to make a difference before they vote.

If you want to make a difference, gather up some leaflets and start uploading.

Wait, where are the Federal election leaflets?

UPDATE: There’s now an archive site of the 2010 Federal Election Leaflets available.

That’s a good question. Rest assured, they’re still there. They just won’t show up when you browse the website (but are still visible if you know an old link).

We haven’t yet built a way to show these leaflets at the same time, but we’re working on it.

As always, we could do with a hand so please volunteer or donate today.

Posted in Announcement, ElectionLeaflets.org.au | Tagged , , , | 2 Responses

Embedding PlanningAlerts in a map just got a whole lot nicer

We’ve a made a pretty small change to the way that applications from PlanningAlerts can get embedded in a map that makes it much easier to use.

It’s easiest to see with an example:

View Larger Map

When you click on one of the points on a map, as well as the description of the development application, there is now a link “More Information” which takes you to the page on PlanningAlerts for that application.

That simple change just made embedded maps a whole lot more useful.

This is how to do it for yourself:

  1. Enter a street address on www.planningalerts.org.au and click Search.
  2. Copy the URL of the link to “Subscribe to an RSS feed for applications near here”
  3. Then go to Google Maps, paste that URL into its search box
  4. Add ?style=html to the end of the URL in the search box. This is the new bit that adds the “More information” link.
  5. Click Search Maps
  6. Click the Link link to the top right of the map, and copy the Paste HTML to embed in website code
  7. Paste that code into your blog post, sidebar, or wherever (you can alter the code to change its size etc.)
Posted in PlanningAlerts.org.au | Tagged , , | 1 Response

Our day at Open Day

We were recently invited to host a stall at the linux.conf.au 2011 Open Day. linux.conf.au is one of the world’s premier free software conferences and is run each year by the community. Open Day is held on the Saturday after the conference and is open to the general public to learn about free and open source software.

Tim ‘mithro’ Ansell and I attended the conference all week and had an excellent time learning lots and meeting interesting people. We volunteered to run the OpenAustralia stall yesterday the 29th of January and it turned out to be a great day.

OpenAustralia volunteers showing the public our projects

We got the chance to meet a whole host of people who had never heard of us and educate them about what we do and what our projects have to offer. It was interesting to find that some people had heard of one of our projects, really enjoyed using it, but were not aware that we run a variety of projects.

We also gave away a bunch of OpenAustralia “Hack Democracy” t-shirts to grinning Open Day attendees.

Open Day visitors show of their new shirts

We’d like to congratulate all of the organisers and volunteers that made linux.conf.au such a success in 2011, against amazing odds. We’d especially like to thank Clinton Roy for heading up the organisation of Open Day and inviting the Foundation to host a stall.

See you next year in Ballarat!

Cheers,

Tim and Henare
OpenAustralia Volunteers

PS. Those that came along to Open Day got an exclusive early announcement of something very special. Stay tuned for more news on this blog in a few days time :)

Posted in Announcement, OpenAustralia Foundation | Tagged , , , , , | 1 Response

Wonderful new features for PlanningAlerts

Today, we’re happy to announce that we’ve added some wonderful new features to PlanningAlerts which are the start of something big.

Until now, the focus of PlanningAlerts has been squarely and clearly about notifying you of new development applications in your area. That notification happens via email.

We’ve added two new big features which allow you to easily explore development applications and comment on them.

Commenting

Finding out about a new development application in your neighbourhood should be the start of something. If it’s something that you agree with or disagree with the standard course of action is that you submit a comment on the development application to your local council.

Really, there should be a way for the community at large to discuss these issues without the local council having to act as an intermediary. Of course, this already happens on the Internet in the form of people writing blog posts, talking on Twitter and Facebook and numerous other avenues.

Wouldn’t it be great if you could see all those conversations in one place, alongside the development application itself? Then, the application page becomes a jumping off point to read what people think all over the place.

To begin with, this is what we’ve done: now whenever you tweet about a development application, and include a link to the PlanningAlerts page, it will be listed on our site:

We’re hoping this will spark discussion and make PlanningAlerts even more useful by allowing people to provide additional information about the development application.

One use of this could be taking a photo with your mobile phone (after find the location using our augmented reality mobile application, of course) and tweeting about it. The link will then show up on PlanningAlerts, allowing others to see what the new development looks like.

Give it a try and let us know what interesting uses you come up with by posting a comment.

Exploring

We’ve also changed the home page. You can now enter a street address and it will immediately show you recent development applications nearby. No need to wait on receiving your first email alert.

This is great for people who’ve never used the service before. They get a taste of what it does before they commit to entering their email address:

We hope you enjoy these new features and don’t forget you can help us improve them by posting a comment below, using the feedback button on PlanningAlerts or, even better, getting involved yourself.

Henare, Kat and Matthew

Posted in Announcement, PlanningAlerts.org.au | Tagged , , , , , , | Leave a comment